Harvard Business School reported that “in a survey of more than 1,000 senior executives conducted by PwC, highly data-driven organizations are three times more likely to report significant improvements in decision-making compared to those who rely less on data. While intuition can provide a hunch or spark that starts you down a particular path, it’s through data that you verify, understand, and quantify.”
The most successful companies in the world make data-driven decisions, and you can too.
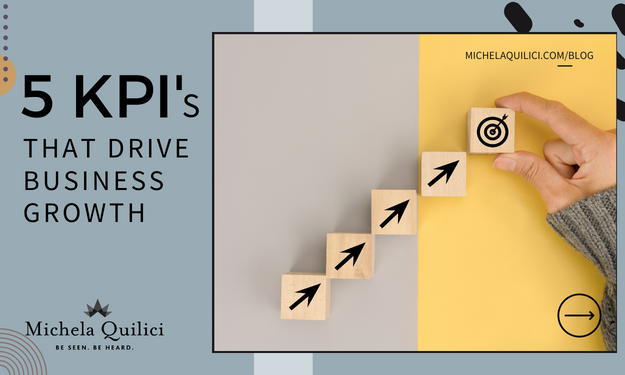
For most people this isn’t a “sexy” topic, however, it’s one that truly drives performance and profits – that’s why top entrepreneurs refer to these as KPIs or “Key Performance Indicators.”
Marketing is both an art and a science. Successful marketing relies on the data of a logical approach and the fluidity of an artistic approach.
Scott Brinker (HubSpot) talks about the principles of good marketing science, two of which are:
- Marketing as a science is about objectively using data to support decision-making
- Marketing as a science is about looking for patterns in the market and customer behaviours – within data
Look at data like the flying instruments in the cockpit of a plane. The metrics tell you if you’re moving in the right direction and when you need to course correct.
What happens when you don’t track your data regularly?
- Do you think it’s possible you could inadvertently be leaving money on the table?
- Are you spending a ton of time in areas that don’t drive impact?
- Are you investing money on strategies that don’t bring you a good ROI?
You are paying a high cost when you don’t track your data.
Without tracking your metrics, you’re shooting in the dark or as I like to say “throwing spaghetti at the wall to see what sticks” – because it’s impossible to know what’s working (and what’s not) without the right metrics in place. You won’t know if what you’re doing is moving the needle in the right direction (or the wrong direction).
So, the question is: “What metrics should I track?”
Track only what you want to improve.
Best-selling author Seth Godin says: “Don’t measure anything unless the data helps you make a better decision.”
There are a lot of different metrics you eventually want to track and improve in your business (particularly at each stage of the marketing and sales process), but for now, here are 5 Key Performance Indicators that you absolutely must start tracking if you’re not already doing so.
- Customer Attrition
This metric will tell you how many customers you’re losing every year, and this is important because if you want to grow your company, and you’ve got 1,000 customers but you’re losing 30% of your customers every year, with everything else being the same, before you can grow your company, you need to replace those 300 customers first – and only then will you be able to grow your new customer base.
For example, in working with a client of mine, we identified that her company’s attrition rate was 30%, and that if we created strategies and tactics around reducing attrition to 15%, it would DOUBLE her profit.
Pretty cool, right? – You don’t have to do all the things, just do the ones that will have the greatest upside.
If you only have one product or service to sell to your customers, your attrition rate is 100%. This means you need to hustle for new clients all the time, to replace the ones you lose.
That’s exhausting and very costly. It also makes your business very transactional, which causes many other issues I won’t get into in this article.
You can reduce your attrition rate considerably if you have the right customer journey strategy, more compelling offers, client communication strategy, email marketing strategies, or various other things in place.
When I work with my private clients, I help them determine the best strategies based on their business model and their current situation, and I support them in effectively implementing and optimizing their results.
- The Average Order Value
There are two ways to look at this metric; (i) average front-end order value and (ii) the average order value as a whole (including repeat purchases).
These are two different figures because when you’re paying to acquire customers and clients, you want to get an ROI as fast as possible. The higher the average front-end order value, the bigger the ROI.
As Jay Abraham said, one of the ways to grow a business is to get your customers to give you more money. So, if you can increase the average front-end order value AND the average order value incrementally by 10% – that adds an enormous impact to the bottom line.
And, you can do more than 10% if you have the right upsell, cross-sell, and point-of-sale promotions in place to name a few examples.
- The Average Order Frequency
This measures how often your clients do business with you. Depending on your business model, it could be: daily, weekly, monthly, quarterly, semi-annually, annually, or every several years.
How frequently are your customers doing business with you? As you increase the frequency – your profits increase.
Most of the time, it’s as easy as educating your consumer with a compelling reason they should do business with you more frequently, putting it into terms that shows them that by doing business with you more often, they’ll get a better result, higher ROI, deeper transformation, etc.
- CPA (Cost Per Acquisition)
Here, we’re talking about the cost of acquiring each new customer.
This is important because if you take your average front-end order value and subtract it from your CPA, the result will tell you the initial return on advertising. In an ideal world, you want your average front-end order value to be more than your customer acquisition cost.
However, if your lifetime customer value is high enough, it’s okay to take a small loss initially to make a HUGE gain down the road.
- LTCV (Lifetime Customer Value)
Because of the long-term reporting of this figure, this is one of the only metrics we don’t track daily. Rather, we track this figure monthly and keep records in a spreadsheet.
The importance of finding your LTCV cannot be stressed enough. It’s a key barometer of the health and success of your business.
This paints a picture of how successful you are with your upsells, down-sells, cross-sells, retention rate, increasing average order value, and increasing the frequency with which your customer does business with you.
As a business coach, I want to see this number RISE over time because it’s an easy way for us to track improvements. If you see this figure falling, it tells you there’s a problem you must address as soon as possible.
Once you create a regular practice of reviewing your data and paying attention to the areas in which you can improve, I can promise that your business will radically transform.
Incremental increases to the KPIs you are tracking will create exponential results!
If you want to get my eyes on your business, DM me and we can hop on a Profit Acceleration Clarity Call and see where you might be leaving money on the table or missing out on cash flow opportunities.
In the meantime, grab my resource guide: Fast Path to Cash to learn 10 fast-action strategies to plug your money leaks.
To your success,